Setting up Visual Studio Code for Windows
Visual Studio Code (abbreviated VS Code) is an open-source text editor developed by Microsoft. It is highly configurable and allows developers to tweak every bit of their workflow to their liking. Configuring it, however, can quickly get involved, which for beginners can be a deal breaker. Windows users in particular may choose to go with Visual Studio Community for a smoother experience.
What's the difference between VS Code and Visual Studio Community?
![]() Visual Studio Community is an IDE for Windows. When you install it, you get all big three components of any respectable C++ development environment at once: an editor, a compiler, and a debugger. All three of them are set up to work together, which means you can get to writing, compiling and debugging code right away.
Visual Studio Community is an IDE for Windows. When you install it, you get all big three components of any respectable C++ development environment at once: an editor, a compiler, and a debugger. All three of them are set up to work together, which means you can get to writing, compiling and debugging code right away.
![]() VS Code is a highly configurable text editor which supports many languages. It's available on many operating systems, packs a lot of developer-oriented features and provides facilities to interact with other tooling. On its own, VS Code is about as good as any other decent text editor, leaving up to you all the extra steps that there are to compiling and debugging C++ code. In order to get closer to an IDE experience like that of Visual Studio Community, you need to install a compiler and a debugger separately, and then configure VS Code to work with them. It's more work, but you end up with a more flexible and customizable setup, and you get acquainted with your toolchain along the way.
VS Code is a highly configurable text editor which supports many languages. It's available on many operating systems, packs a lot of developer-oriented features and provides facilities to interact with other tooling. On its own, VS Code is about as good as any other decent text editor, leaving up to you all the extra steps that there are to compiling and debugging C++ code. In order to get closer to an IDE experience like that of Visual Studio Community, you need to install a compiler and a debugger separately, and then configure VS Code to work with them. It's more work, but you end up with a more flexible and customizable setup, and you get acquainted with your toolchain along the way.
This entire page will guide you through installing and configuring all the tools you need to use VS Code as a C++-ready IDE. Be aware, though, that it is going to be a fairly long read. The amount of new information was kept at a minimum, but it can still be lots to take in. Take breaks if you feel like you need them. This page isn't going anywhere, so go at your own pace. 🙂
About this page
The instructions which follow are largely sampled from HolyBlackCat's repository of C++ tutorials. Feel free to visit it for a more in-depth tour of the options you have and the rationale behind the choice of tools we will be installing.
Installing a C++ toolchain
A toolchain is a set of tools which when used together can turn C++ code into an executable file. This section explains how to install Clang and its associated tools through MSYS2, a distribution of MinGW.
Quick glossary
MinGW, an acronym for "Minimalist GNU for Windows", is a set of common Linux tools which were ported to Windows to provide a Linux-like environment on Windows. MinGW does not have an official installation binary, instead we get to choose from different distributions of MinGW.
MSYS2 is one such packaging of MinGW. It is complete, convenient, up-to-date and still maintained today.
Clang is a compiler. Its job is to compile C++ code and to produce an executable file. Clang comes with a bunch of tools that we'll be using throughout this page, and installing Clang through MSYS2 allows us to have the entire suite of Clang-related tools installed with it.
- Download the installer from the MSYS2 website and run it.
Leave the default install location unchanged. If for some reason you must change it, make sure it contains only unaccentuated Latin characters and no spaces. In short, use only letters from A to Z with no accent (so no à é ïô and the likes), and use hyphens - or underscores _ rather than spaces. The rest of this page assumes that you installed MSYS2 in the default location, C:\msys64.
If you run into any strange issues during installation (or at any later point), try disabling your antivirus software or adding the MSYS2 install location as an exception in its settings.
Uncheck the Run MSYS2 now option at the end of installation, or close the window that the installer opens.
- Start MSYS2
The Windows Start menu will have several different shortcuts. Select the one which reads MSYS2 CLANG64.
The window that opens is called a "terminal" or a "console". You can type commands in there to interact with the MSYS2 environment.
Make sure the prompt reads CLANG64 in purple text. If it says something else, you used the wrong shortcut. Close that terminal and start the correct one instead.
- Update MSYS2
The following commands should all be run in the MSYS2 CLANG64 terminal. First, run pacman -Syu.
Pasting commands in the MSYS2 terminal
Ctrl + V doesn't work in the MSYS2 terminal. Instead, use Shift + Insert, or right-click anywhere and select "Paste".
When you run the command above, you will eventually be asked to confirm the operation:
:: Proceed with installation? [Y/n]Press Enter to continue.
It is possible that you get this message sometimes:
:: To complete this update all MSYS2 processes including this terminal will be closed. Confirm to proceed [Y/n]Press Enter and the terminal will close. If this happens, restart the MSYS2 terminal and run pacman -Syu again to finish the update.
What is pacman?
pacman is the package manager for the MSYS2 environment. Packages can be anything ranging from programs and libraries to text files, and pacman is a convenient utility which knows where to fetch packages from, how and where to install them, how to update them, how they depend on one another so you don't have to figure that out yourself.
This command you just ran updated pacman's package database (the list of places where it can fetch packages from) and upgraded to newer versions the installed packages which were found to be outdated. It's a good idea to run this command every once in a while to keep your tools up-to-date.
- Install the Clang toolchain
Run pacman -S mingw-w64-clang-x86_64-clang to install the entire Clang toolchain. Press Enter when asked to confirm. You'll notice that a fair amount of stuff is getting installed. This is pacman working its magic to install not just Clang and its associated tools but also every other package required for them to properly function.
After a short while, the installation will be over. Now, type clang++ --version. You should see something like this:
clang version 20.1.0
Target: x86_64-w64-windows-gnu
Thread model: posix
InstalledDir: C:/msys64/clang64/bin
This means you successfully installed Clang.
Installing VS Code
Go the VS Code website, download the installer, and run it to install VS Code. This doesn't require any special instructions, just make your way through the installer.
Next, we need to tell it how to work with all the tools we installed in the previous sections. We'll begin with the terminal. Start your freshly installed VS Code.
First encounter with the VS Code terminal
VS Code has a built-in terminal, which you can open by selecting View→Terminal in the top bar. A panel should appear:

Just like the MSYS2 terminal that you used before, you can use this to type commands and run them. However, if you go ahead and try to run clang++ in it, like you did before, you are going to get an error:
PS C:\Users\user> clang++ --version
clang++ : The term 'clang++' is not recognized as the name of a cmdlet, function, script file, or operable program. Check the spelling of the name, or if a path was included, verify that the path is
correct and try again.
At line:1 char:1
+ clang++ --version
+ ~~~~~~~
    + CategoryInfo          : ObjectNotFound: (clang++:String) [], CommandNotFoundException
    + FullyQualifiedErrorId : CommandNotFoundException
That is because this terminal instance uses a different shell, in this case PowerShell, as is displayed by VS Code in the top-right corner of the terminal pane.
What is a shell?
A shell is a program that accepts commands from you (such as clang++ --version, which you ran above) and executes them (often by running other programs, in this case by running the Clang compiler).
A terminal is a dumb program that displays text. A shell is what actually understands the commands you type.
A shell and a terminal are usually used together: the terminal provides the window and draws text in it, while the shell interprets the user commands. The MSYS2 terminal from before uses a shell named Bash.
You can usually recognize a shell by its prompt (the text it prints when asking you for a command). You have to know which shell you're using, because as you noticed the difference can matter: you can run clang++ in MSYS2 Bash but not in PowerShell by default.
When you ran clang++ --version in the MSYS2 terminal, it ended up running a program named clang++.exe located at C:\msys64\clang64\bin: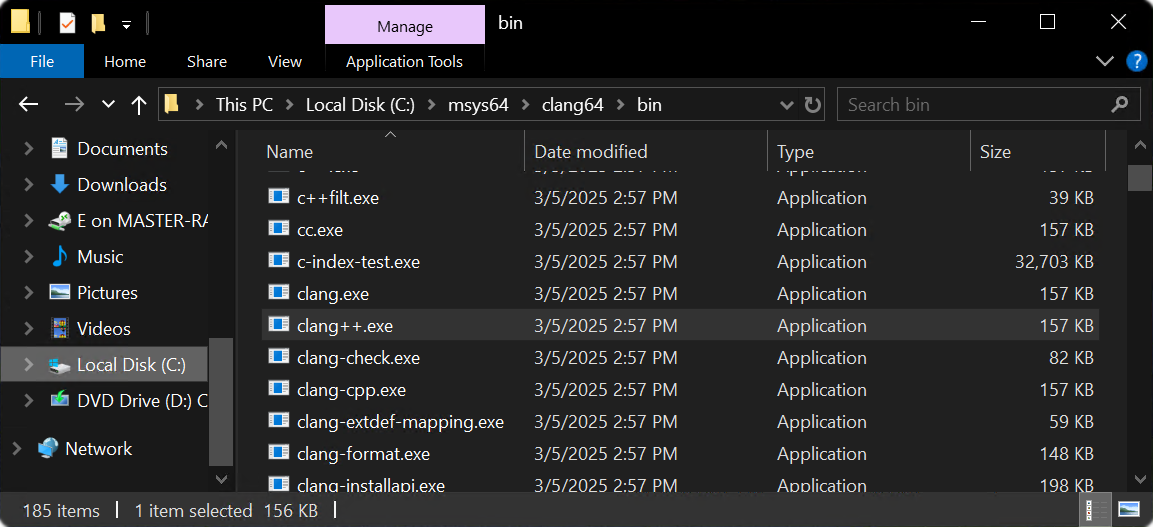
The reason why the MSYS2 shell knew to look there for clang++.exe is because of a setting called PATH.
The PATH environment variable
PATH is a list of directories that will be searched by a shell when it needs to run a program. To see the contents of PATH, run echo $env:PATH in VS Code's PowerShell and echo $PATH in the MSYS2 terminal. The commands are different because the shells that you run them in are different, and expect things to be in a slightly different format. You should see this: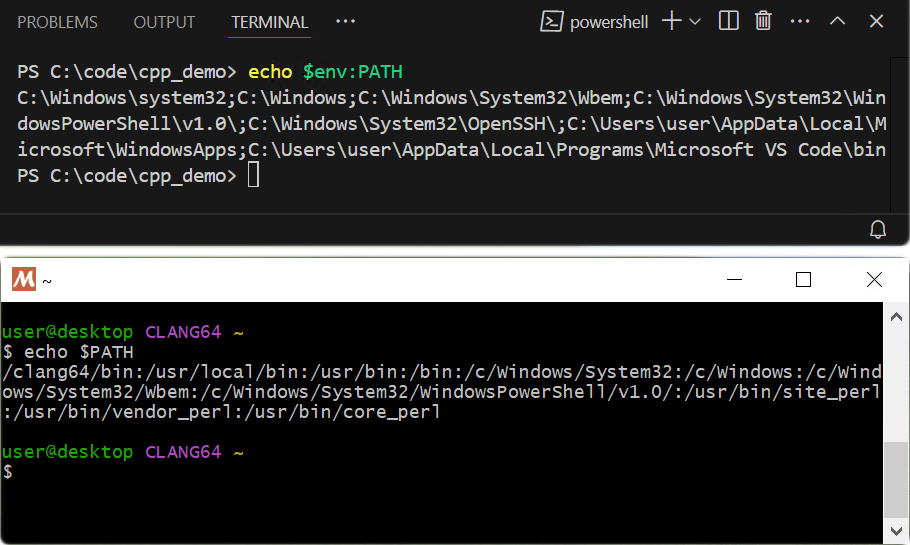
Yours might not exactly match those on the screenshot, but the point is that we get two different lists of directories.
In MSYS2, the first one is /clang64/bin. The / at the beginning refers to the MSYS2 installation directory, so this entire path actually translates to C:\msys64\clang64\bin. This directory is where clang++.exe is located, and this is why the MSYS2 shell knows what to do when asked to run a command like clang++ --version. In PowerShell however, this directory isn't listed at all, which is the reason PowerShell did not understand that command.
Luckily, the fix is simple: we only need to change the value of PATH in Windows.
To do so, type env in the Windows search bar, and choose Edit the system environment variables. Then in the window which opens, click the button which reads Environment Variables....
You will see two lists of variables, with Path in both of them. The top list (User variables) applies only to the Windows user whose session is currently open, while the bottom list (System variables) applies to every user on this computer. In this case, you want to modify the System variables, and add the C:\msys64\clang64\bin directory at the very beginning of the list (click the button labeled New, edit the path, and then press the Move up button a bunch of times). Doing so gives it the most priority, which will spare you a bunch of trouble in the future. 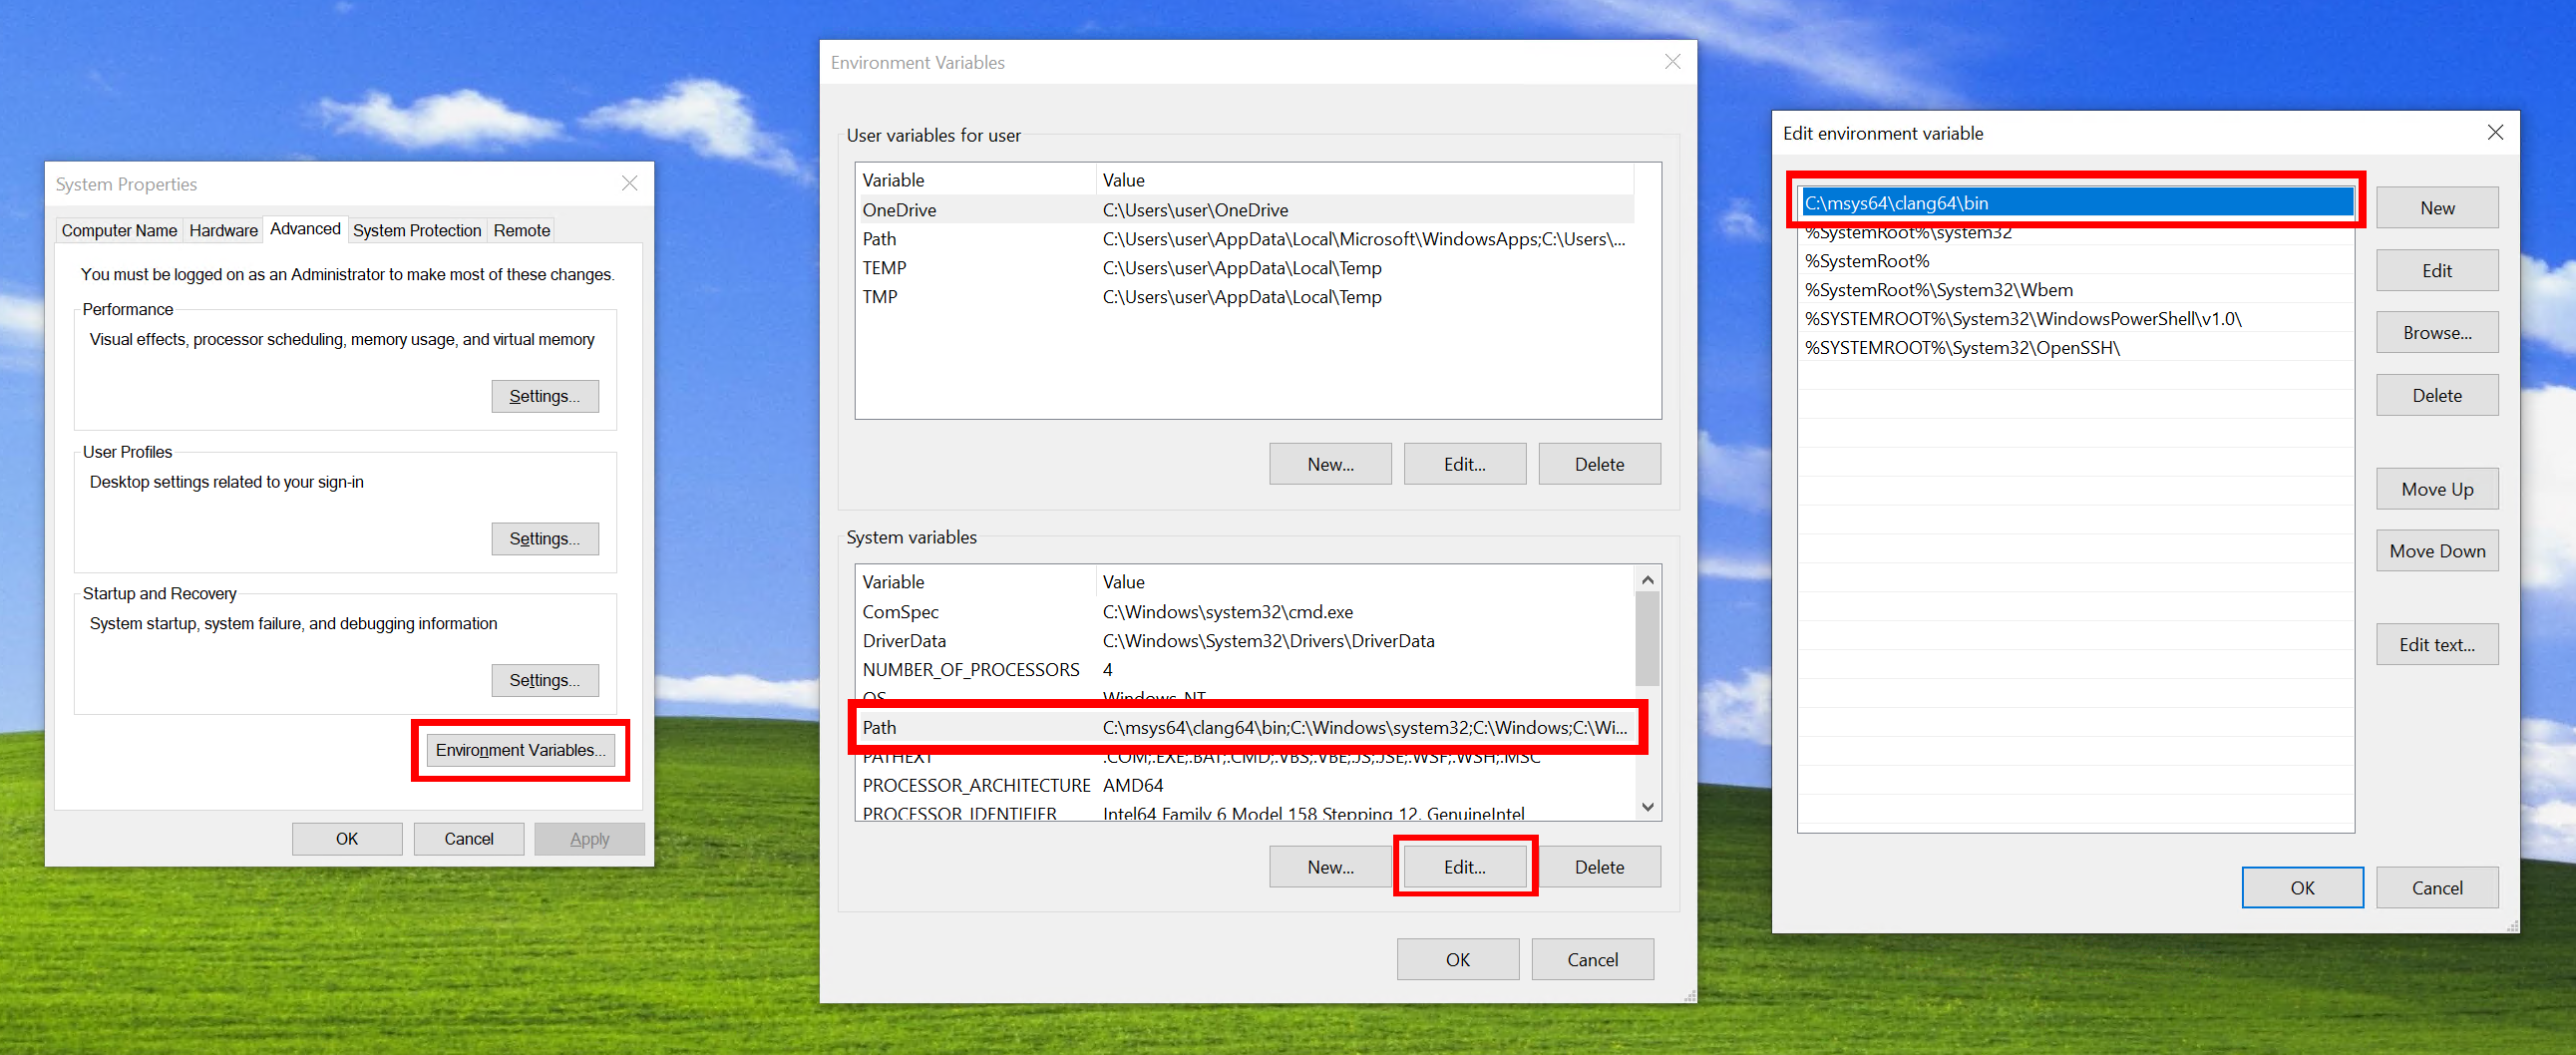
When you're done modifying PATH, restart VS Code. This is needed for the changes to be propagated to the built-in terminal. After restarting, if you try to run clang++ --version again in the VS Code terminal, it should give you the same output as it did in the MSYS2 terminal.
Restarting VS Code
Make sure to restart VS Code! Close the window and launch VS Code again. If, for any reason, you have several VS Code windows open, close them all and then launch VS Code again.
Changes to the PATH environment variable will not be seen nor accounted for by VS Code unless you restart it completely, and invoking clang++ in the built-in terminal will keep producing an error until you do.
If you run echo $env:PATH again, it should now list C:\msys64\clang64\bin as the first entry in the list: 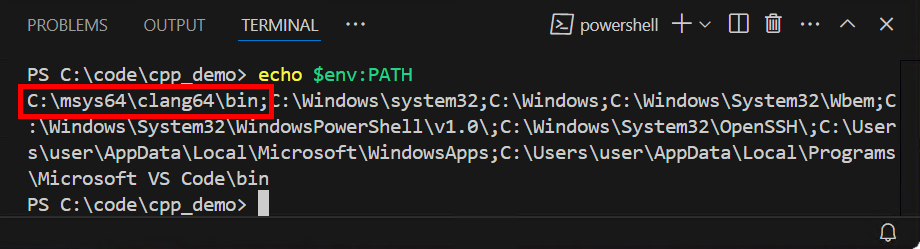
At this point, you are ready to write C++ code and compile it with the terminal, all from VS Code.
Your first C++ program
Finally, it's time. First, you'll have to create a workspace. Workspaces are VS Code's very loose equivalent of what other IDEs might call a project. Any directory on your disk can be opened as a workspace in VS Code, and when you do so, VS Code simply lists the files that it contains and lets you work with them. The structure of the actual project (or projects, plural!) which live within the workspace is completely unconstrained by VS Code.
Let's create a workspace then. On the welcome page in VS Code, select the "Open folder" option. If you closed the welcome page, you can bring it back by selecting Help→Welcome in the top bar. Alternatively, you can tell VS Code to open a folder with the key chord Ctrl + K, Ctrl + O.
Pressing key chords
Sometimes, usual key shortcuts like Ctrl + S or Ctrl + Z are not enough, and specific actions call for slightly more complex shortcuts. That's what key chords are.
When you see something like Ctrl + K, Ctrl + O, you need to press Ctrl + K first, and then press Ctrl + O. You can keep the Ctrl key pressed for the entire duration of the chord and simply press K and then O in quick succession.
VS Code is full of those. Some of them are more useful than others, but all of them can be customized to your liking.
In the Explorer window which opens, browse to a location you can easily find back later and create a new directory, which will be the workspace for your first C++ program. You can give this directory any name you like, but avoid spaces and accented or non-Latin characters, as some tools tend to choke on those. Once created, select your new workspace directory and click the "Select folder" button at the bottom-right of the Explorer window.
At this point, VS Code might be asking you whether you trust the authors of the workspace you're trying to open. This is only a concern when you're working on projects that you fetched online from untrustworthy sources. Click the button which reads "Yes, I trust the authors".
Your window should now look like the following: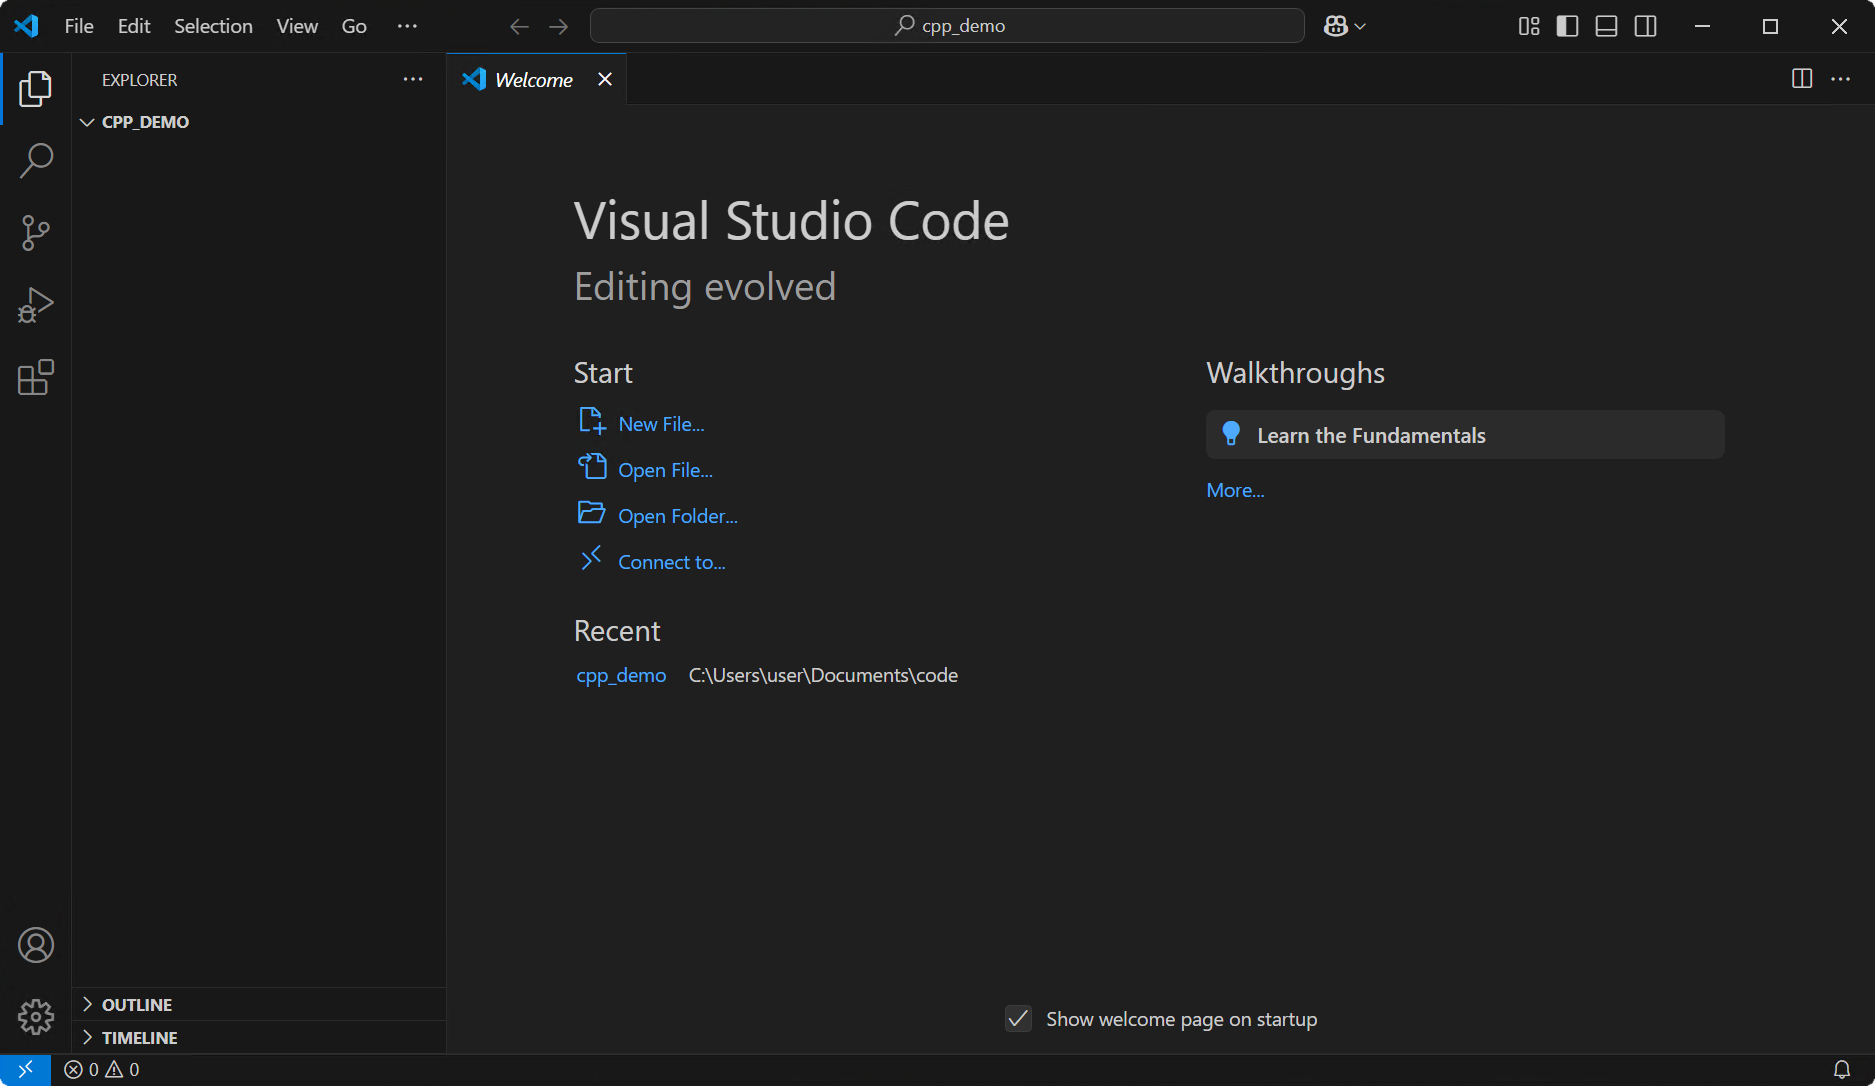
Not much has changed, except for the left sidebar. It's labeled Explorer, and its job is to show the files and directories that your workspace contains. At the moment there are none, that's why it's completely blank except for the name of the workspace directory (CPP_DEMO in the screenshot above). Let's fix that right now by adding some files.
If you hover on the sidebar, which we will now refer to as the file explorer, you'll see a bunch of icons showing up in the top-right corner:![]()
Click on the leftmost icon to create a new file in the workspace. VS Code will add an entry in the file explorer and will wait for you to give it a name. It can be anything, as long as it does not contain spaces, nor accented or non-Latin characters, and it should also have the .cpp extension. For example, prog.cpp is a correct name.
File extensions
Conventionally, the extension of a file is the bit which comes after the last dot in the file name. It can be arbitrarily long or small, and it's even possible to have a file without an extension. In any case, the extension of a file is supposed to give an idea of what that file contains.
By giving our new file the extension .cpp, we tell VS Code that this file is a C++ source file, meant to contain C++ code. As a consequence, VS Code will apply C++ syntax highlighting to any code we write in this file.
Once you're happy with your new file's name, press Enter. VS Code creates the file and immediately opens it in the editor for you.
WARNING
It is possible at this point that VS Code might be trying to be smarter than it really is, by suggesting that you install the "C/C++ extension pack". Ignore that suggestion and dismiss the pop-up. Do not install the extension pack. We will get to that in a short time.
Paste the following bit of C++ code in your newly created file:
#include <iostream>

int main() {
    std::cout << "Hello!" << std::endl;
}This code, when ran, will print "Hello!" in the terminal. The specifics of it are not so important for now, the goal is simply to test that your setup works. Save your file by pressing Ctrl + S while the editor is focused.
Saving files
When you type in VS Code's editor, you can see your modifications live. Those modifications make it to the disk only when you save the file. If you forget to save your file and then compile it, you'll actually be compiling a previous version of your file, and the results will not be consistent with your expectations. This is a common source of confusion among beginner programmers.
VS Code shows the status of the file next to its name in the editor tab at the top.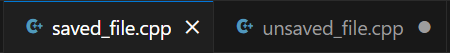
A white dot in place of the cross button indicates that the file has unsaved modifications. Such modifications are not present on disk and cannot be compiled until you save the file, which you can do by pressing Ctrl + S while having the file open and focused in the editor.
The next step is to actually compile your file. Open the terminal again by selecting View→Terminal in the top bar. You'll see that something is slightly different from the last time: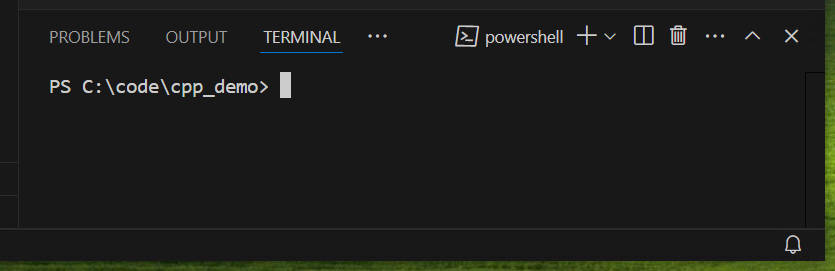
VS Code has opened the terminal in our workspace directory, as you can tell from the path printed as part of the prompt. This is a good thing, it will save us some typing. If you named your C++ file prog.cpp, the command to compile it is the following:
clang++ prog.cpp -o my_first_program.exeLet's break down that command a little bit:
clang++: that is the name of the compiler executable. PowerShell will findclang++.exeand run it.prog.cpp: this is the C++ file that we want to compile. You should change this to match the name that you gave to your C++ file in the previous steps.-o: in a command, something which begins with a dash-is an option. In short, options allow you to tell the invoked program how to behave. The available options depend on the program. For Clang, the-ooption is there to tell that whatever follows next will be the name of the output file thatclang++will produce. In our case, the name is...my_first_program.exe: following the-ooption, this is the name of the executable file that we end up with. It can be anything, the only requirement is that it has the.exeextension so that Windows recognizes it as an executable file.
Tweak the command so that it matches your situation, and press Enter to run it. A successful compilation will print nothing. If there's an error in the compiled code, it will be printed in the terminal. If you have errors, check that the content of your C++ file matches the code from above and make sure that you save the file before trying to run the command again.
After the compilation is successful, you should see a file named my_first_program.exe appear in VS Code's file exporer. This is indeed your first C++ program. You did it! You can try to run it from the terminal by typing ./my_first_program.exe, and see for yourself that it indeed prints Hello! in the terminal before yielding back to the prompt.
If running your program does nothing or yields an error, make sure you correctly followed the instructions regarding the PATH environment variable. In particular, C:/msys64/clang64/bin must be in the system-wide PATH, not the user-specific PATH, and it has to be the first element in the list of directories.
Before we go on, here are details about a couple noteworthy oddities that you might have noticed and which deserve some clearing up.
The terminal's current directory, relative paths and absolute paths
Terminals have a concept of a "current directory". The shell usually reminds you what the current directory is, by printing its path as part of the prompt. Usually, most paths that you provide in a command are considered to be relative to the current directory. This is why we were able to supply prog.cpp to Clang only by its name, and not by its full path: when VS Code opened our terminal, it set its current directory to our workspace directory, and from there, prog.cpp is enough to locate the C++ source file that we created.
There is only one case in which a path is not considered a relative path, and that's when the path is an absolute path. Absolute paths have a specific form and are never relative to a given directory. They unambiguously identify a location in the file system. On Windows, absolute paths start with a drive letter and a colon. Continuing the example from above, C:/code/cpp_demo/prog.cpp would be the absolute path to our C++ source file. We could have supplied that path in the compile command, instead of just prog.cpp, Clang would have happily compiled it all the same. It's just more typing.
The ./ prefix for invoking programs in PowerShell
The ./ prefix is made of two characters: ., which designates the terminal's current directory, and /, the universal path separator.
TIP
On Windows, \ is the historical path separator, but / works equally well and is more accessible, so we use that instead.
In essence, ./my_first_program.exe simply means: "I want to run the file my_first_program.exe located in the current directory". Following the previous remarks about relative paths and whatnot, you might wonder: if our terminal's current directory is our VS Code workspace, and our executable file was written to that same directory, then why did we need such a prefix at all? Wouldn't my_first_program.exe have sufficed as a command? This is a quirk of PowerShell: by default, invoked programs are not searched in the current directory as a safety measure. The ./ prefix is required to prevent you from doing something that you otherwise might not have intended.
Spaces in paths
Up until now, you have been advised not to include spaces or accented or non-Latin characters in the paths you're dealing with. While the latter kind of such characters can indeed present issues, spaces can be fine most of the time. If a path has spaces in it and you want to supply it as a command line argument, you have to put double quotes around it so that the entire path is considered as one whole argument. For example:
clang++ prog.cpp -o "my first program.exe"However, spaces in paths have a history of causing subtle problems which can be stupidly hard to diagnose. For this reason, paths with spaces are unconventional and generally avoided. If you need a non-alphabetic separator in a path, underscores _ are a perfect candidate for a replacement.
With that out of the way, we can move on.
Code completion
Code completion is a feature most IDEs have which provides suggestions as you type your code.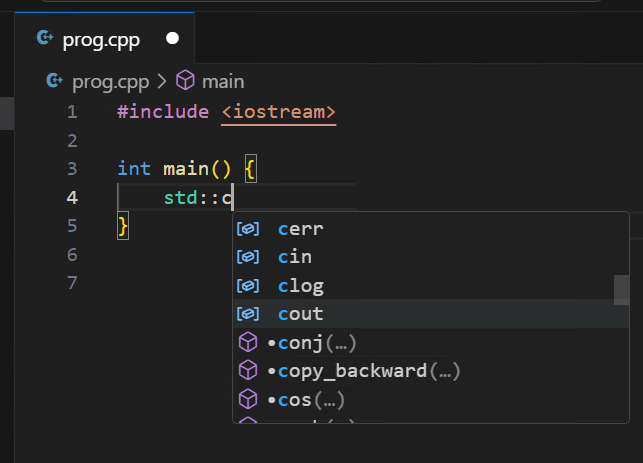
It's usually the same component which underlines your code with red squiggles when it contains errors, without having to compile.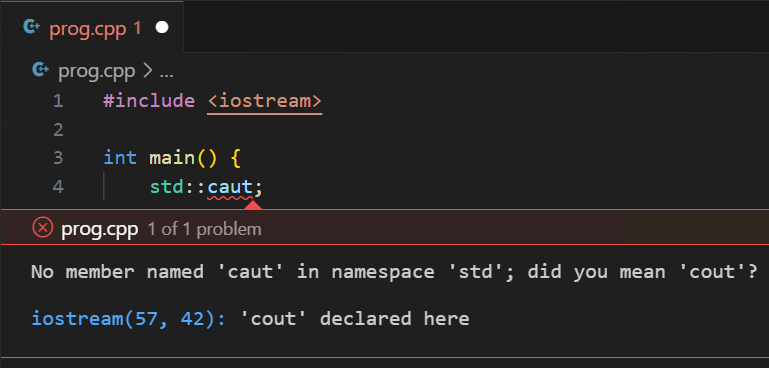
You don't have to use code completion, and writing a few simple programs without code completion is a good learning experience. But for more complex projects it's invaluable.
VS Code does not support code completion on its own. For most languages, you have to install an extension. We will be installing Clangd (not to be confused with Clang), a C++ language server. Language servers are the things which actually power features such as code completion and the likes.
Clangd is a separate program that we need to install in MSYS2, outside VS Code. Open the MSYS2 CLANG64 terminal again (make sure to open the CLANG64 variant) and run the command pacman -S mingw-w64-clang-x86_64-clang-tools-extra. This will install Clangd right next to the other Clang tools which we installed previously.
There is one final issue before code completion is properly set up: VS Code doesn't know how to speak with Clangd. To bridge the gap between the VS Code editor and the Clangd executable that we just installed, we need to add the Clangd extension to VS Code. It will act as a middle man between both, enabling code completion.
Go to the extension marketplace in VS Code, search for Clangd, and install what should be the first result:
That's all you have to do. Now if you go back to your C++ file and type nonsense in it, red squiggles should not take long to appear.
If you get this pop-up after installing the Clangd extension: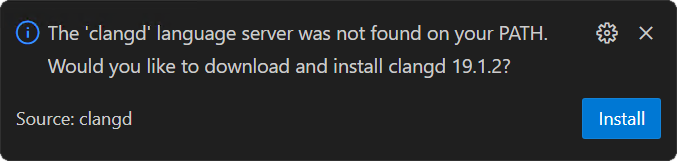
Do not click on Install. We just installed Clangd via MSYS2, and the extension is supposed to be using it. The Clangd extension not finding the Clangd program that we just installed suggests one of two things:
- As hinted by the text in the pop-up, your
PATHis not properly configured. Refer to the instructions for setting up thePATHenvironment variable. Don't forget to restart VS Code afterwards. - You installed Clangd in a different MSYS2 environment (instead of the CLANG64 environment that we're using since the beginning), which would also explain why it can't be found on your
PATH. Install Clangd from MSYS2 again, this time in the correct environment. Once you did that, restart VS Code to reload the Clangd extension.
Automating compilation
Compiling manually in the terminal like we did before gets old very quickly. You can automate this in VS Code by binding hotkeys which will run the compile command for you. To that effect, we will be using something called tasks.
A task in VS Code is a prepared shell command that you can run by pressing a hotkey or a button in the UI. To create a task:
- Open the command palette by pressing Ctrl + Shift + P.
- Start typing
Tasks: Configure Task, and select the corresponding option once it comes up. - Select
Create tasks.json from template. - Finally, select
Other.
This will create a .vscode directory in your workspace, and within it, a file named tasks.json, which is then opened in the editor.
The VS Code command palette
VS Code exposes all of its functionality through the command palette, which can be opened with Ctrl + Shift + P. It's a very useful shortcut to know about, and we'll be using it a bunch in the next steps.
The .vscode directory is where VS Code stores all of its configuration and settings that are specific to the current workspace. In there, tasks.json is a text file which will contain the tasks configured for your workspace. Right now it should be looking something like this: 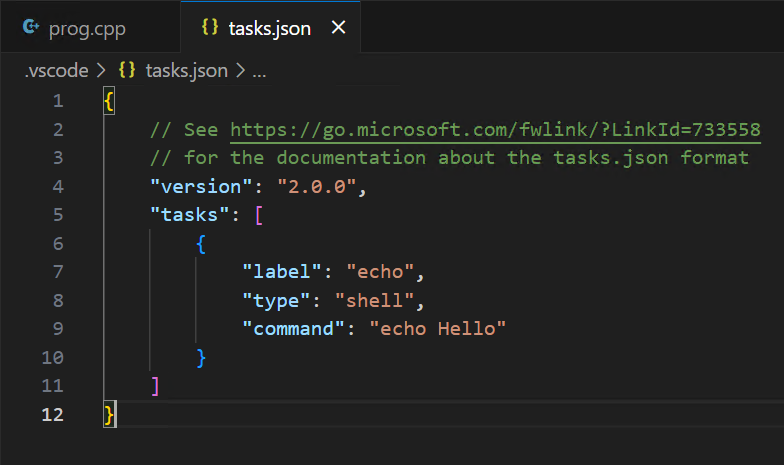
It helps if you're familiar with the JSON format, but it's also fine if you're not. This is how tasks are defined for your workspace. The field labeled "tasks" is a list, which begins with [ and ends with ], and inside this list we currently have one object, delimited by the pair of curly brackets { and }, at lines 6 and 10 in the image above. This object is a task, and its own fields define the properties of the task. Here we can see that it's a shell command (field "type") labeled "echo" (field "label") and that the command ran by this task is echo Hello (field "command").
You can try to run it right away, by opening the command palette (Ctrl + Shift + P) and selecting Tasks: Run task (start typing and select it when it shows up). Then, choose echo in the dropdown. At this point, you'll be presented with one more dropdown, asking you to Select for which kind of errors and warnings to scan the task output. In the options below, select Never scan the task output for this task. You'll notice that a new field gets added to our task object in the tasks.json file: "problemMatcher": []. This field is used to tell VS Code how to parse errors in the output of the task in order to put red squiggles under the appropriate places in your code. It's a bit of a pain to configure properly, and we don't need it anyway, since Clangd already handles red squiggles for us. "problemMatcher": [] basically corresponds to "no problem matcher", so we're clear on that end. Finally, you should have noticed that Hello was printed in your terminal. This means the task worked! Run it once again, and notice that VS Code no longer pesters you about scanning the output for problems -- because the task is now configured to do nothing about that.
Printing Hello in the terminal seems a bit silly, but we're going to tweak this task so that it compiles our code for us. No more typing in the terminal! You can go ahead and perform the following replacements in the task object:
- Change
echo Helloto the compile command you used previously (clang++ prog.cpp -o my_first_program.exeor similar). - Change
"label": "echo"to something more descriptive of our purposes, for example"label": "Compile".
Don't forget to save. You can then run the task like you did before (it will have a different label), and observe it compile your C++ file for you. Try putting nonsense in your C++ file, don't forget to save, and errors should show up in the terminal when you run the task. If nothing gets printed, it means the compilation was successful.
Let's add a task which runs the compiled program. In tasks.json, duplicate the task object and add a comma between the two objects. In the second object, change the label to "Run", and the command to "./my_first_program.exe". The result should look like this:
{
  // See https://go.microsoft.com/fwlink/?LinkId=733558
  // for the documentation about the tasks.json format
  "version": "2.0.0",
  "tasks": [
    {
      "label": "Compile",
      "type": "shell",
      "command": "clang++ prog.cpp -o my_first_program.exe",
      "problemMatcher": []
    },
    {
      "label": "Run",
      "type": "shell",
      "command": "./my_first_program.exe",
      "problemMatcher": []
    }
  ]
}
Now you can run the Compile task, followed by the Run task, in order to compile your C++ code and run the generated executable. But running two tasks in a row isn't very convenient. Luckily, we can automate this too: add a new field "dependsOn" to the Run task object (don't forget to separate it from the previous field by a comma), and have its value match the label of the Compile task. Your Run task should look like this:
{
  "label": "Run",
  "type": "shell",
  "command": "./my_first_program.exe",
  "problemMatcher": [],
  "dependsOn": "Compile"
}
Now, when you run the Run task, the Compile task will be ran first, and only then the Run task will run.
This is all getting rather convenient and usable, but it can get better. We can define one task to be the default build task, which gives it a dedicated keyboard shortcut. Open the command palette again, and select Tasks: Configure Default Build Task. In the dropdown, select the Compile task. Now, you get to compile your code with Ctrl + Shift + B. If you take a look at the tasks.json file, you'll notice that VS Code has updated the Compile task to reflect that it is now the default build task, by adding a field "group": {"kind": "build", "isDefault": true}.
What about the Run task?
You might be wondering why we didn't bind the Run task to Ctrl + Shift + B, since it would run the Compile task too. To keep it short, Ctrl + Shift + B is the shortcut associated with building your code, which is a different thing from running the built executable. Not to worry however, we're getting a shortcut for running your build right in the next section, with an added bonus.
Setting up the debugger
The debugger allows you to pause your program while it executes and to inspect its memory while it's paused. When you write a bug, at some later point you'll notice that your program doesn't do what it's supposed to do. When that's the case, your first reflex should be to run your program with the debugger. By seeing the code executing step by step on your screen, inspecting the contents of variables and checking your assumptions as you go, you'll be able to track the issue directly back to where it originates. The debugger won't fix the issue for you, but it's pretty much the fastest, tried-and-true way to identify the issue and understand why it happens.
Do not skip this section!
The debugger is your most invaluable tool right next to the compiler. Without a compiler, you can't turn your code into an executable. Without a debugger, you're setting up yourself for painfully hard times understanding why your code behaves wrong -- and it will, eventually. It's not a skill issue, you will write bugs, everyone does. Some bugs are trivial to find and fix, some others much less so. When you encounter the latter kind, you'll be glad to have a debugger at your disposal.
We'll be installing LLDB-DAP. Much like Clangd, LLDB-DAP is a program that we have to install via MSYS2, and then we need to add an extension to VS Code, which will be the middle man between the installed LLDB and VS Code itself.
TIP
The actual debugger is called LLDB. DAP stands for debug adapter protocol, kind of a specification which states how debuggers should "speak" to VS Code. LLDB-DAP simply wraps the plain LLDB executable, but "speaks in DAP" so that VS Code can understand it.
An extension is still needed on top of all that for proper integration within VS Code's UI.
Open up the MSYS2 CLANG64 terminal again, run the command pacman -S mingw-w64-clang-x86_64-lldb and let it do its thing. That's it for installing LLDB.
Then, open VS Code's extension marketplace, search for LLDB DAP, and install the first result: 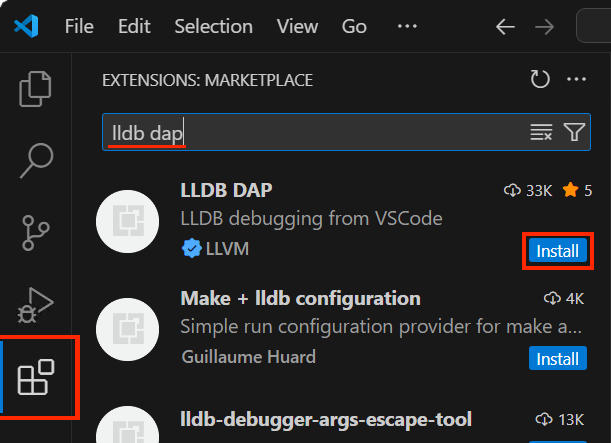
Now we need to tell the extension where to find the LLDB-DAP executable. Click the LLDB DAP entry from the search results in the extension marketplace pane to open the extension's overview. Near the Disable and Uninstall buttons, there should be a small cog on the right. Click it and select Settings in the dropdown menu which appears: 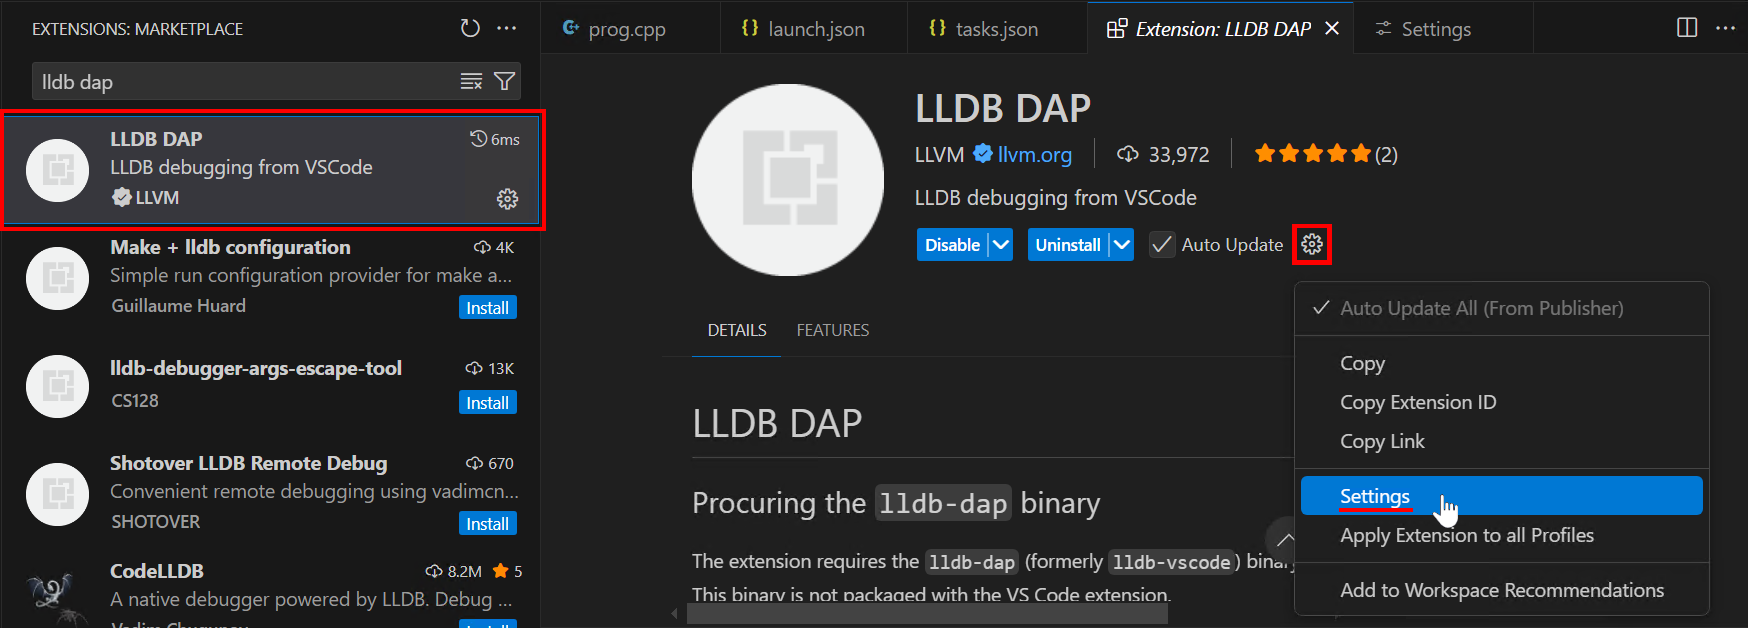
You'll be taken to the extension settings. In that page, locate the Lldb-dap: Executable-path setting (you can use the search bar at the top), and put C:/msys64/clang64/bin/lldb-dap.exe as the value.
Opening VS Code's settings
You can also open the settings from the top bar, by selecting File→Preferences→Settings, or from the command palette, by selecting Preferences: Open settings (UI). Once in there, use the search bar to locate a particular setting. You'll find both settings for VS Code itself and settings for installed extensions in this page.
We're almost ready to debug our program. There's one more thing we need to change: debugging a program requires that the executable is built in a way that makes it debug-friendly, and for that we need to provide an additional option to our Clang compile command. Open your tasks.json file (in the .vscode folder), and add the -g option to the command line for your Compile task. It should now read something like clang++ prog.cpp -o my_first_program.exe -g. Run the Compile task right away. If you don't, later you'll be attempting to debug an executable which was not built for debugging purposes, and it's going to be confusing.
And last but not least, we need to tell VS Code how to start our program in a debug session with LLDB DAP. Click on the Run and Debug button in the left sidebar. In the pane that opens, click on create a launch.json file, and select the LLDB DAP Debugger option in the dropdown: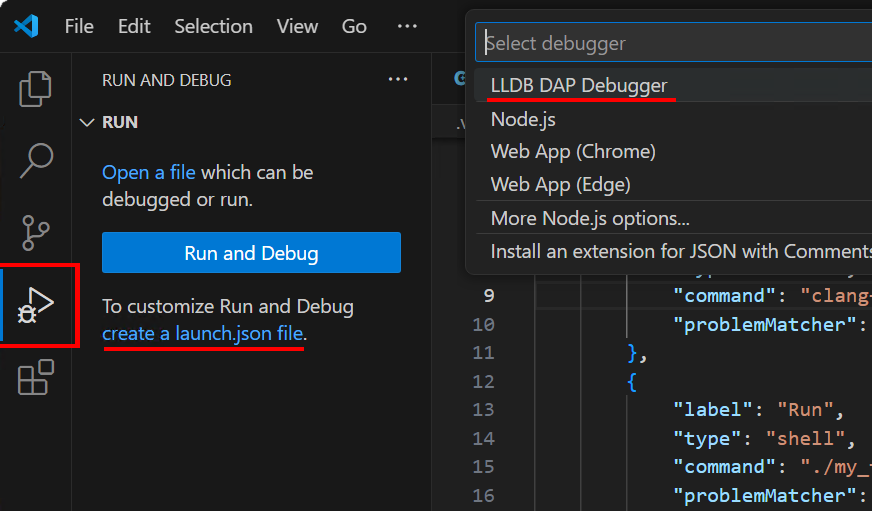
This creates a file named launch.json next to the tasks.json file in the .vscode folder: 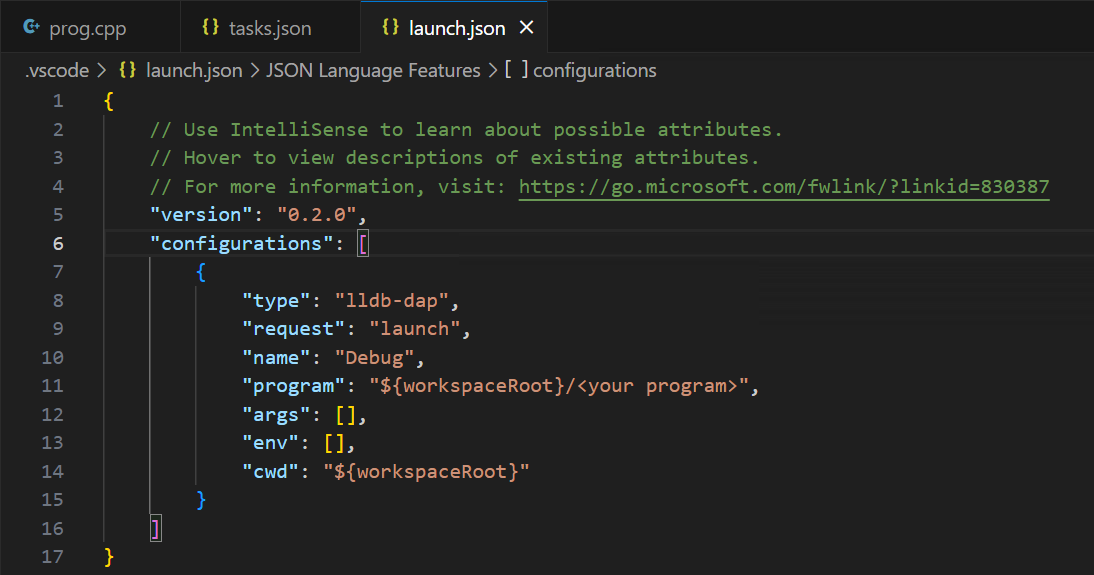
This file is meant to contain all debug configurations for your workspace. Much like tasks.json, it mainly consists in a list of configurations, of which there is currently only one. It's slightly more complex than tasks, but we don't have to do much to make it work: simply replace <your program> by the name of the executable file generated by your compile command, my_first_program.exe if we were to continue the examples from above. ${workspaceRoot} is a configuration variable which contains the path to your C++ workspace. Do not touch it, just leave it alone and keep the slash between it and your program name: ${workspaceRoot}/my_first_program.exe. Make sure you save the file after editing it.
You are now ready to debug! Let's make your program do a couple more interesting things than just printing to the console. Copy and paste this in your C++ file:
#include <iostream>

int main()
{
    int x = 2;
    int y = 3;
    int z = x + y;

    std::cout << "z is " << z;
}In order for these changes to make it to the compiled executable, you can go ahead and run your Compile task once more.
Then, click on line 5, on the left of the line numbers. A red dot should appear: 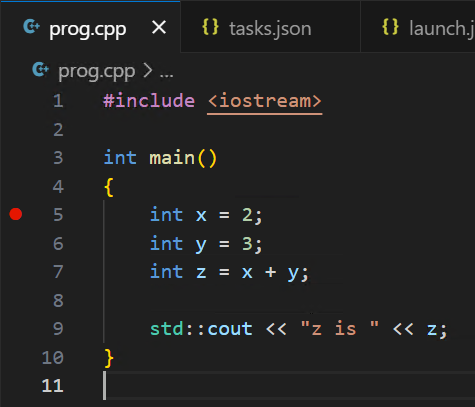
This is called a breakpoint. When your program runs in a debug session, it will be paused when the execution reaches this line. Actually, let's just try it. Follow these instructions:
Press F5 to start debugging. Pretty much immediately, the line with the breakpoint should become highlighted in yellow and a bunch of stuff should have showed up in the
Run and Debugpane on the left.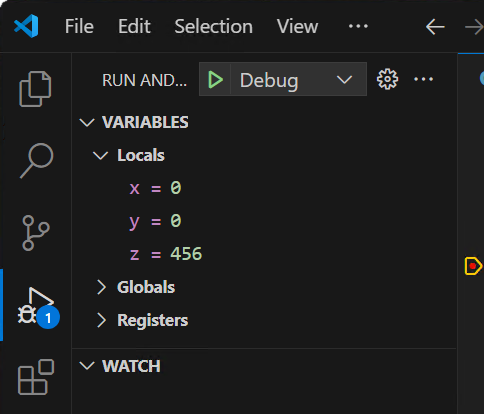
Press F10 to execute the highlighted line of code. Now line 6 should be highlighted in yellow, and the value of
xin the left pane should have changed to2.Press F10 one more time to execute line 6, advancing execution by one line again. Line 7 should now be highlighted, and
yin the left pane should have taken3as value.Press F10 one last time, executing line 7. You should now see that
zin the left pane has a new value:5, which turns out to be the result ofx + y(whose values were 2 and 3 respectively when the addition was carried out).Finally, press
F5to resume execution until the next breakpoint. Since there are no more breakpoints, our program just finishes running.
F5?
While not in a debug session, F5 is the shortcut to run the current debug configuration. You can see the currently selected debug configuration at the top of the Run and Debug pane of VS Code: 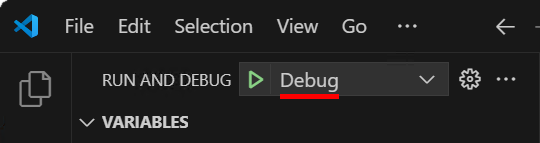
During a debug session, F5 is the shortcut to resume execution until the next breakpoint is encountered (at which point the program pauses again).
What about the last line in the program? Wasn't it supposed to print something? Yes, and it did. However, the output generated by programs during debug sessions goes to a dedicated tab called the Debug Console. It should be visible by default right next your terminal tab, but if not you can bring it up by selecting View→Debug Console in the top bar. Open up the debug console, and hopefully this is what you should see: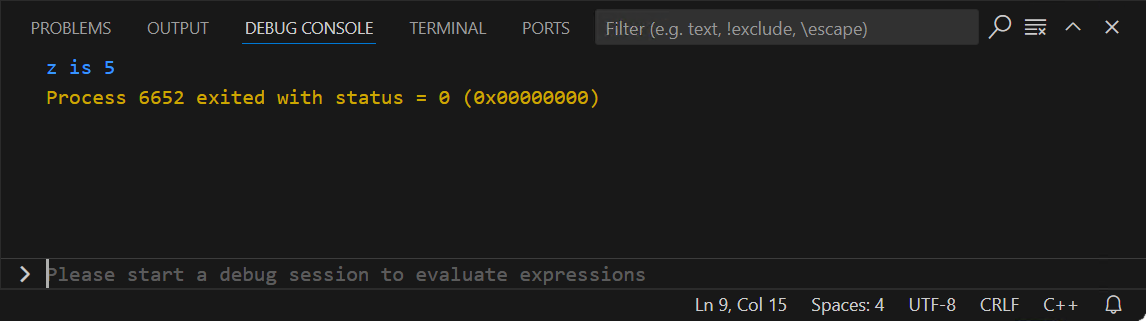
The console output is there, and we also get the confirmation that our program exited normally after resuming (this is what status = 0) means.
Troubleshooting
When I press F5 I get this error window
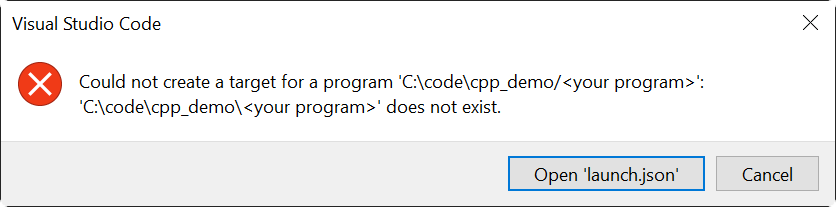
You did not edit your launch.json file correctly, or you forgot to save it.
None of the stuff shown above appears in the Run and Debug pane during the debug session
You forgot to recompile your program after adding option -g to your compile command. Make sure that -g is present in your compile command (task Compile) and that your tasks.json file is saved. Run your Compile task and try debugging again.
Bonus
Every time you want to run or debug your code after having made changes to your source files or to your compile command, you'll have to rebuild your executable. If you don't, you'll notice confusing inconcistencies and will be left wondering why they happen. Not noticing that you're debugging or running an outdated build can result in wasted effort. Lots of it. Fortunately, this is avoidable: leave to someone else the responsibility of remembering to rebuild!
Open your launch.json file, and add a new field after the last one: "preLaunchTask": "Compile". Don't forget to insert a comma between this field and the previous one, and to save the file once you have edited it. As of now, every time you launch a debug session with this configuration, the Compile task will be ran, generating an up-to-date executable that the debug session will then be started on.
You're all set up now. Congrats! You can use VS Code as a fully-featured IDE for C++.