Using the debugger in CLion
CLion comes with bundled GDB and LLDB, so you don't have to install these yourself. If you are using a toolchain automatically detected by CLion (see our CLion article), one of these are already selected for you.
Placing breakpoints
Breakpoints are used to stop your program on the given line before the line runs.
Let's see a small program that defines a variable x and multiplies it by 3. We will observe the value of this variable throughout the program.
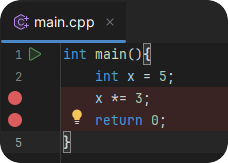
int main(){
    int x = 5;
    x *= 3;
    return 0;
}
When you hover a line number, a red circle should appear. Click on it to place a breakpoint: Let's place 2 breakpoints, one on the x *= 3; line, and one on the return 0; line.
Let's start our program using the green bug icon.
Stepping through your program
What you'll see as soon as you start your program is that your debugger has hit the first breakpoint and the program is paused.
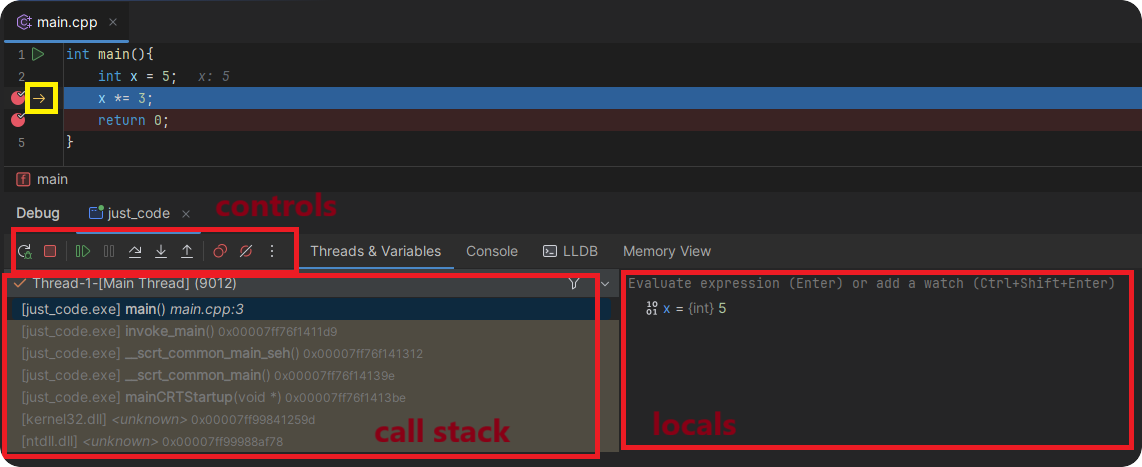
At the bottom of the CLion window, a new "Debug" tab should open.
The yellow arrow (surrounded by the yellow rectangle) is an indicator of where your program is paused at.
On the left, you can see the call stack: the functions called in order to reach the line that your program is currently paused on. We will check this out later.
To the right, you can see the local variables that are declared in the scope of the function that the program is currently in.
In our case, you can see that we only called the main function (as well as a bunch of implementation defined C runtime functions) and our only local variable is x with a value of 5.
Now we will step through the code line by line.
We can control the debugger with the "control" buttons at the top of the CLion debug UI.
The most important ones are:
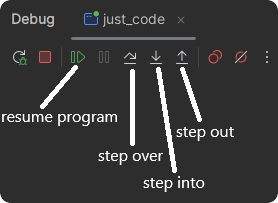
- Resume Program: When your program is paused, use this to continue execution (until the program exits or the next breakpoint is hit).
- Step over: Step to the next line. This will skip any function calls on the current line.
- Step into: Similar to "Step over", but it will step into functions on the current line.
- Step out: Immediately steps out of the current function by running all lines until the function returns.
Useful when you are stuck in some function that you do not care about.
Click the "Step over" option. Your code will hit the second breakpoint, as it is on the next line (the debugger usually ignores empty lines).
As you can see, the previous line that multiplied x by 3 executed, so the value of x is now 15.
Now press "Resume Program" to execute the rest of the program
Conditional breakpoints
There are scenarios where you know that your program has a bug when a certain variable has a certain value, but the value only occurs once every thousand calls or so. This is where conditional breakpoints come in:
int foo(int x) {
    return 5 / (x - 3);
}

int main(){
    [[maybe_unused]] int a = foo(3);
    [[maybe_unused]] int b = foo(5);
    return 0;
}
Let's place a breakpoint on the return line of foo. Of course the "buggy" value is x=3 in our case (because in that case we divide by 0), so let's set up a conditional breakpoint for that. Instead of left-clicking on the line number, right click it. This will bring up a menu where you should select the Conditional breakpoint... option.
This will bring up a little window where you can enter your condition (x == 3). The condition has to be a valid C++ expression.
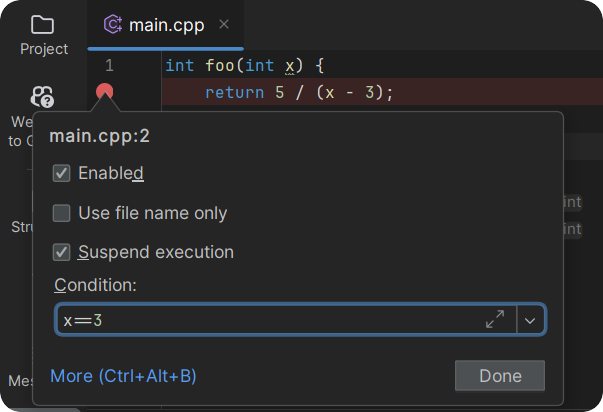
When debugging the program, the breakpoint will be hit on the first function call (as the condition is satisfied), but not on the second function call.
The call stack
Sometimes you want to know where a function was called from. The call stack shows you all the functions that were called to reach the current line.
Let's use this example code:
#include <print> // C++23 feature

void my_function() {
    std::println("print");
}

void foo() {
    my_function();
}

void bar() {
    int x = 4;
    my_function();
}

int main(){
    foo();
    bar();

    return 0;
}
Now place a breakpoint into the single line of my_function.
Now debug your program. The first time we hit a breakpoint, lets observe the call stack on the UI.
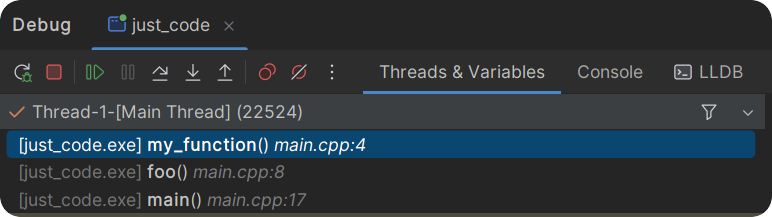
As you can see, the call stack shows that we first called foo from main, then called my_function from foo.
Let's resume the program. You should see the second breakpoint being hit.
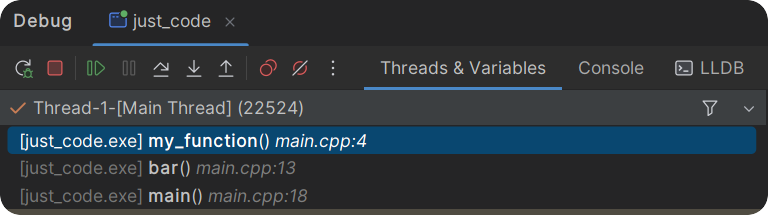
We can observe a similar situation as last time, but now my_function is being called from bar, but this isn't why we have two functions. Click on the bar function on the call stack UI.
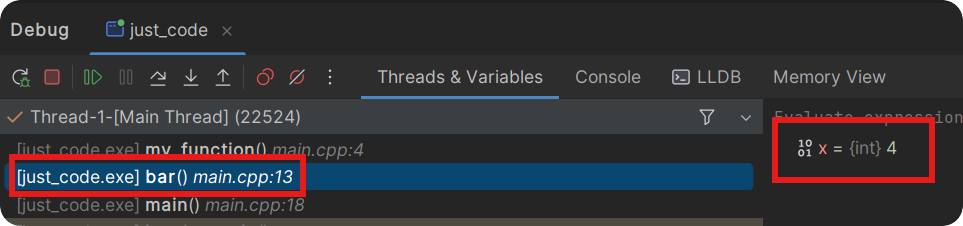
As you can see, you are now observing the state of the locals in the function bar right before it called my_function. This is useful to see what context a function was called from.
Let's resume the program to let it run and quit.
Evaluating expressions
In CLion's debugger, you can evaluate expressions at runtime with the values at the current line.
Let's see an example. Put a breakpoint on the single line in my_function!
#include <print> // C++23 feature

struct foo {
    int x;
    int some_op() {
        return x * 5;
    }
};

int my_function(foo f) {
    return f.some_op() * 2;
}

int main(){
    foo f{3};
    int value = my_function(f);
    std::print("{}", value);
    return 0;
}
Here, we can't observe the return value of f.some_op(), because it isn't a local variable, it is a member function that has to be ran to be evaluated. Here, we can use the "Evaluate expression" box at the top of the local variable column.
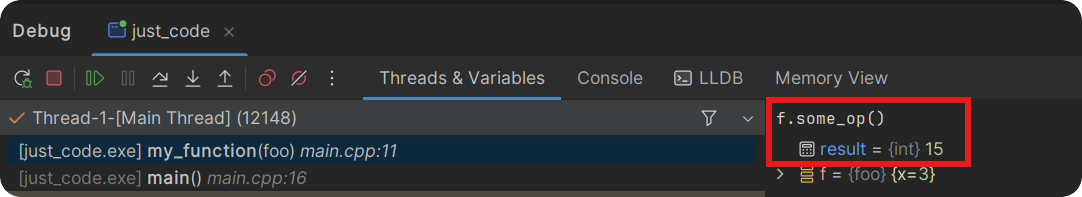
As you can see, the expression evaluates to 15, as it should.
WARNING
The code you evaluate actually runs and side effects can act weirdly when using this feature. Only use this to test calculations with no side effects or state changes!